“All things entail rising and falling timing. You must be able to discern this.” - Miyamoto Musashi in Go Rin No Sho (Book of Five Rings)
Crypto has long enjoyed independence from the traditional finance markets, perhaps due to the low-interest-rate environment or its relative obscurity. But the fallout from the pandemic, war in Ukraine, looming regulations, 3AC, Terra and FTX collapses, and global inflation concerns have made headlines and crumpled portfolios.
Our previously isolated world of web3 may yet suffer from the effects of more macro contagion and catastrophe, but the rhythm of both the inflation and crypto market cycles may provide a source of opportunity for those with conviction who are willing to be the first on the dance floor.

Under Pressure
The “bullwhip effect” severely stung the supply chain in the wake of COVID’s influence on consumer buying habits. Massive increases in demand for particular goods – exacerbated by stimulus checks providing an inflow of freshly minted dollars into our pockets – caused manufacturers to ramp up production, only for that demand to fall off a cliff as the pandemic panic eased. The duet of COVID and the war in Ukraine resulted in buying habits shifting from toilet paper and home gym equipment to essentials like food and energy.
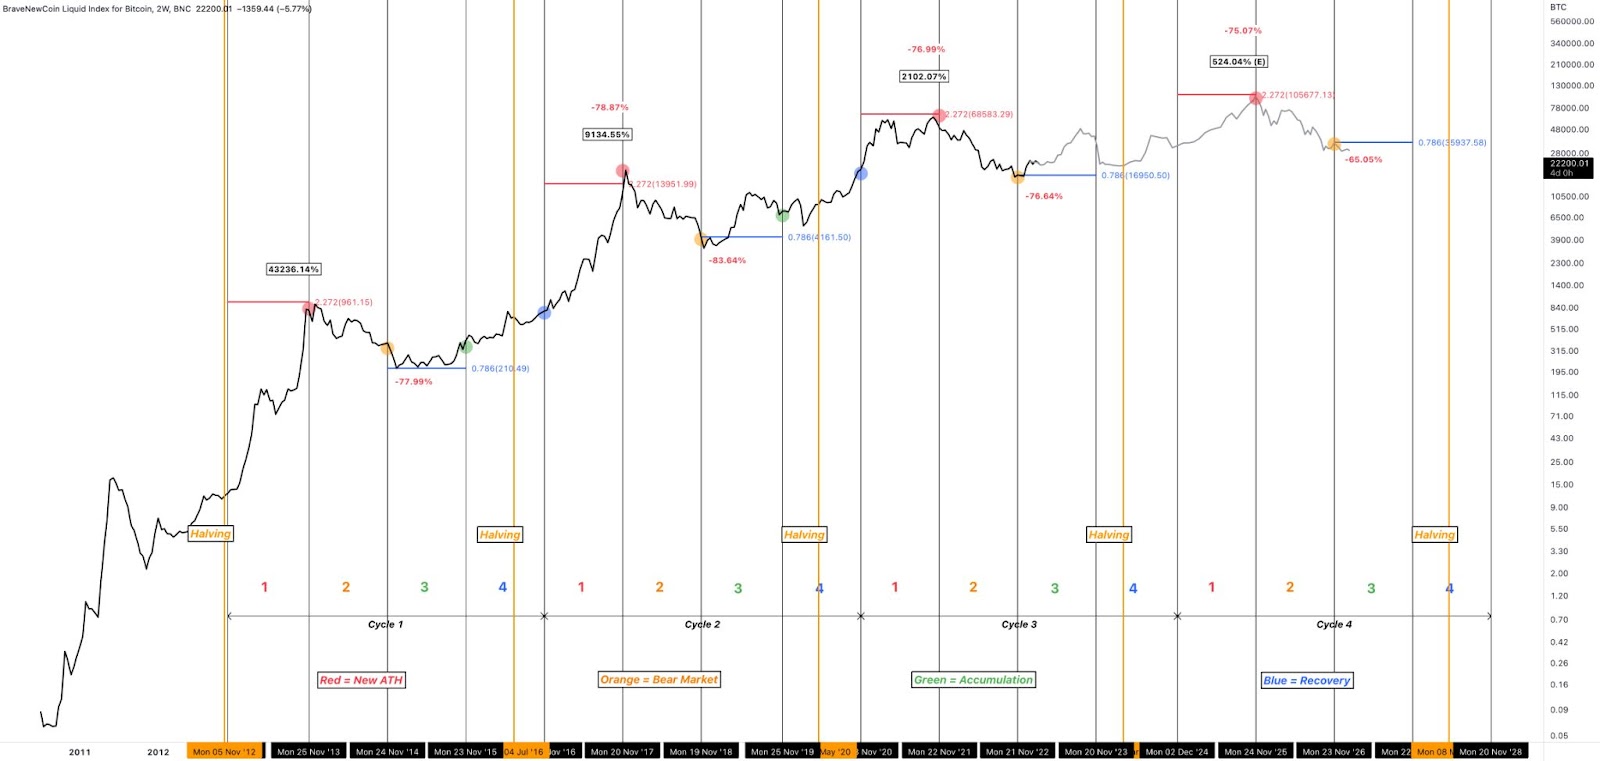
Likewise, crypto markets have historically been subject to the tempo that the BTC halving cycle has on supply and demand. Every four years, the amount of BTC rewards per block is reduced by half – historically causing a corresponding increase in value. While this effect has been predictable during Bitcoin’s decade-long lifetime, investors have struggled to time the market due to panic at a deep cyclical bottom and euphoria at a parabolic top.
It seems the broader economy is also susceptible to this same emotional rollercoaster. The blunt instruments of Federal interest rates were dialed down to a whisper during COVID, then cranked up to 11 in a matter of months as the effects of overstimulation caused inflation to roar.
This drastic U-turn has exposed the reality that policymakers and the economy are largely out of sync, and that the Fed has little choice but to overcompensate in response to laggy data. Silicon Valley Bank was the first casualty of this new high-rate environment, and is a singing canary for what awaits many other banks.
Mo’ Money Mo’ Problems
As inflation data rolls in over the months ahead, it will become clear whether the Fed’s policies have had the desired effect of taming inflation. Whether it will come at the cost of inducing additional economic breakage remains to be seen, but the fear of a run on regional banks is palpable. This fear has led to sudden shifts in the investment landscape, prompting investors to reassess their risk tolerance, re-evaluate portfolio compositions, and consider an alternative store of value with a known monetary policy and transparent ledger.
A shock to most (but unsurprising to doomer crypto natives), the collapse of major banks has caused a surge of interest in Bitcoin as a hedge against bank runs and hyperinflation. Crypto markets have felt the ripples from these broader economic tides, with prices surging across the board. An encore of J-Pow and his money printer to bail out banks would only continue this trend.
The savvy investor (in crypto, equities, or fallout bunkers) can stay tuned into a few primary indicators for measuring the health of the economy. As the United States sets the tone for most international economics, US-based indicators are ideal data points.
For more on the influence that U.S. dollar dominance exerts over international monetary policy, check out Crypto’s Bakumatsu: How the U.S. Strong Armed DeFi.
Material Girl
Consumer Price Index
The Consumer Price Index (CPI) is a widely used economic indicator that measures the average change in the prices paid by consumers for a basket of goods and services over time. It is used to gauge the rate of inflation in an economy and to assess the cost of living for consumers.
Over the past 60 years, the first quarter of the year generally showed the highest month-to-month change, with the trend falling through Q2 and Q3 and reaching a yearly low in the final quarter. The chart below presents this trend visually, with the highest levels highlighted in blue, and the lowest in red.

The years 1973-1981 stand out as being particularly impacted by strong inflationary pressure. Despite this shift in beat, the final months of the year consistently posted weaker inflation numbers. This parallels the relief seen after encouraging data was posted in 2022, only to be slapped down in January 2023 by the uptick from expectations.
Personal Consumption Expenditures Index
The comprehensive Personal Consumption Expenditures index (PCE) covers most consumer goods and services, and is a Fed favorite for determining monetary policy. Once again this index posts the least favorable numbers in Q1, while trending lower through Q4.

Source: BEA Interactive Data Application
US Producer Price Index
The Producer Price Index (PPI) gives insight into the cost pressures faced by the producers of goods themselves. While many makers attempt to resist raising costs to avoid being tuned out by their consumer base, at a certain point these producers buckle and pass along their cost increases to consumers. Debilitating increases in costs can force these companies to cut labor and overhead.
As we saw for both CPI and PCE, the PPI historically trends lower throughout the year.


Purchasing Managers Indices
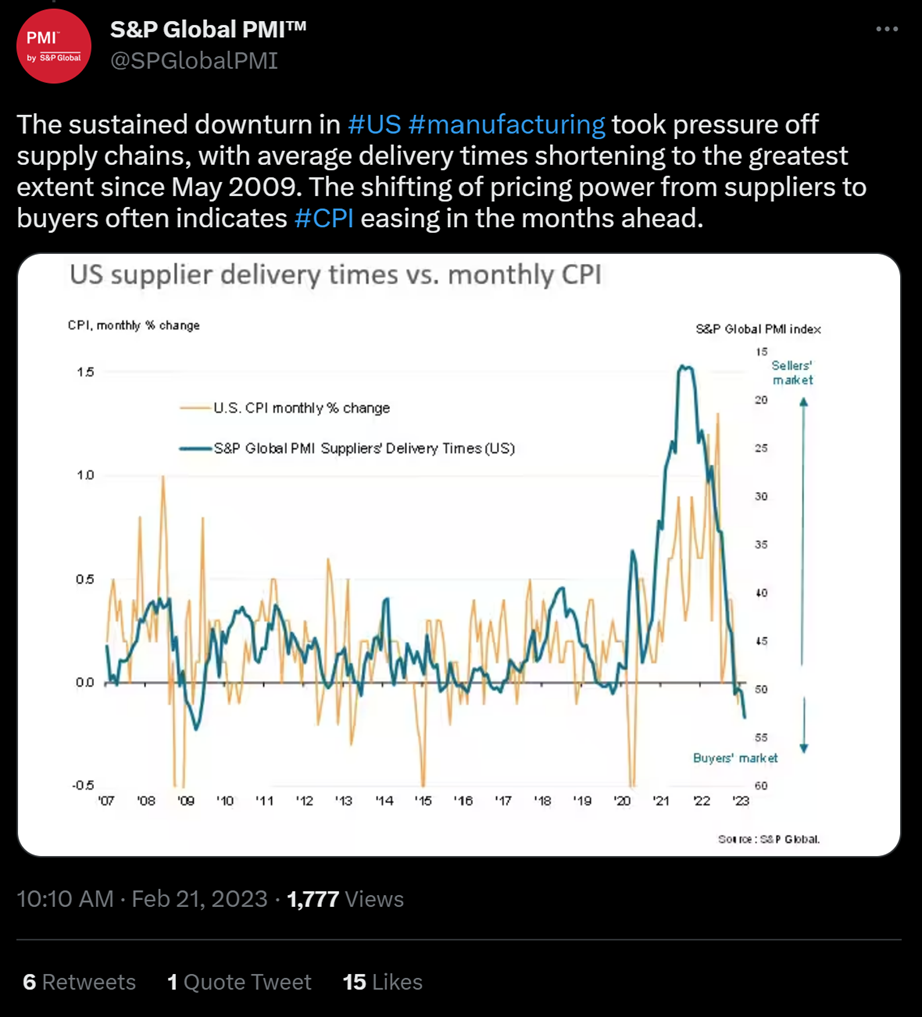
The Purchasing Managers Indices (PMI) offer useful insights into the latest trends from professionals in their respective industries. It is worth noting that while inflation is ticking upwards, manufacturers are seeing softening demand and easing price pressures – likely due to forward-thinking business leaders who are expecting a recession and planning accordingly. The latest insights shared in these reports suggest that this rhythm is likely to hold over the coming months.


Closing Time
In studying economic cycles, we notice a natural ebb and flow. The key question is how changes in inflationary pressures harmonize with the impact of rate hikes and the expectations of the markets. If the historical choreography remains intact, the second half of the year could signal the beginning of a downturn in this inflationary cycle. However, the unprecedented events of the past few years could force the economy to lead with another foot.
The underlying patterns of boom and bust are strikingly similar in both the larger economy and crypto. Navigating these cycles requires an understanding of market mechanics and an iron gut, but investors who can recognize the patterns and emotions driving both realms may be better positioned to capitalize on opportunities as they arise.

😉 🫡
Until next time,
☢️ ❄️Stay frosty ☢️ ❄️
- GH0ST
Resources
- PPI and CPI - Bureau of Labor Statistics Data (bls.gov)
- PCE Index - BEA Interactive Data Application
- S&P Global PMI - PMI, Purchasing Managers’ Index – Manufacturing, Services (spglobal.com)